2018.09.25
People Working for ALMA (3) Visualize the invisibles: Professional in Data Analysis to Create Image from Radio Data
What is “Seeing Radio Waves”?
— I’d like to start from a very basic question. What does it mean by “seeing radio waves” or “seeing at radio wavelengths”?
Nagai: This is a question we are asked very often. It must be a difficult concept to understand for the general public.
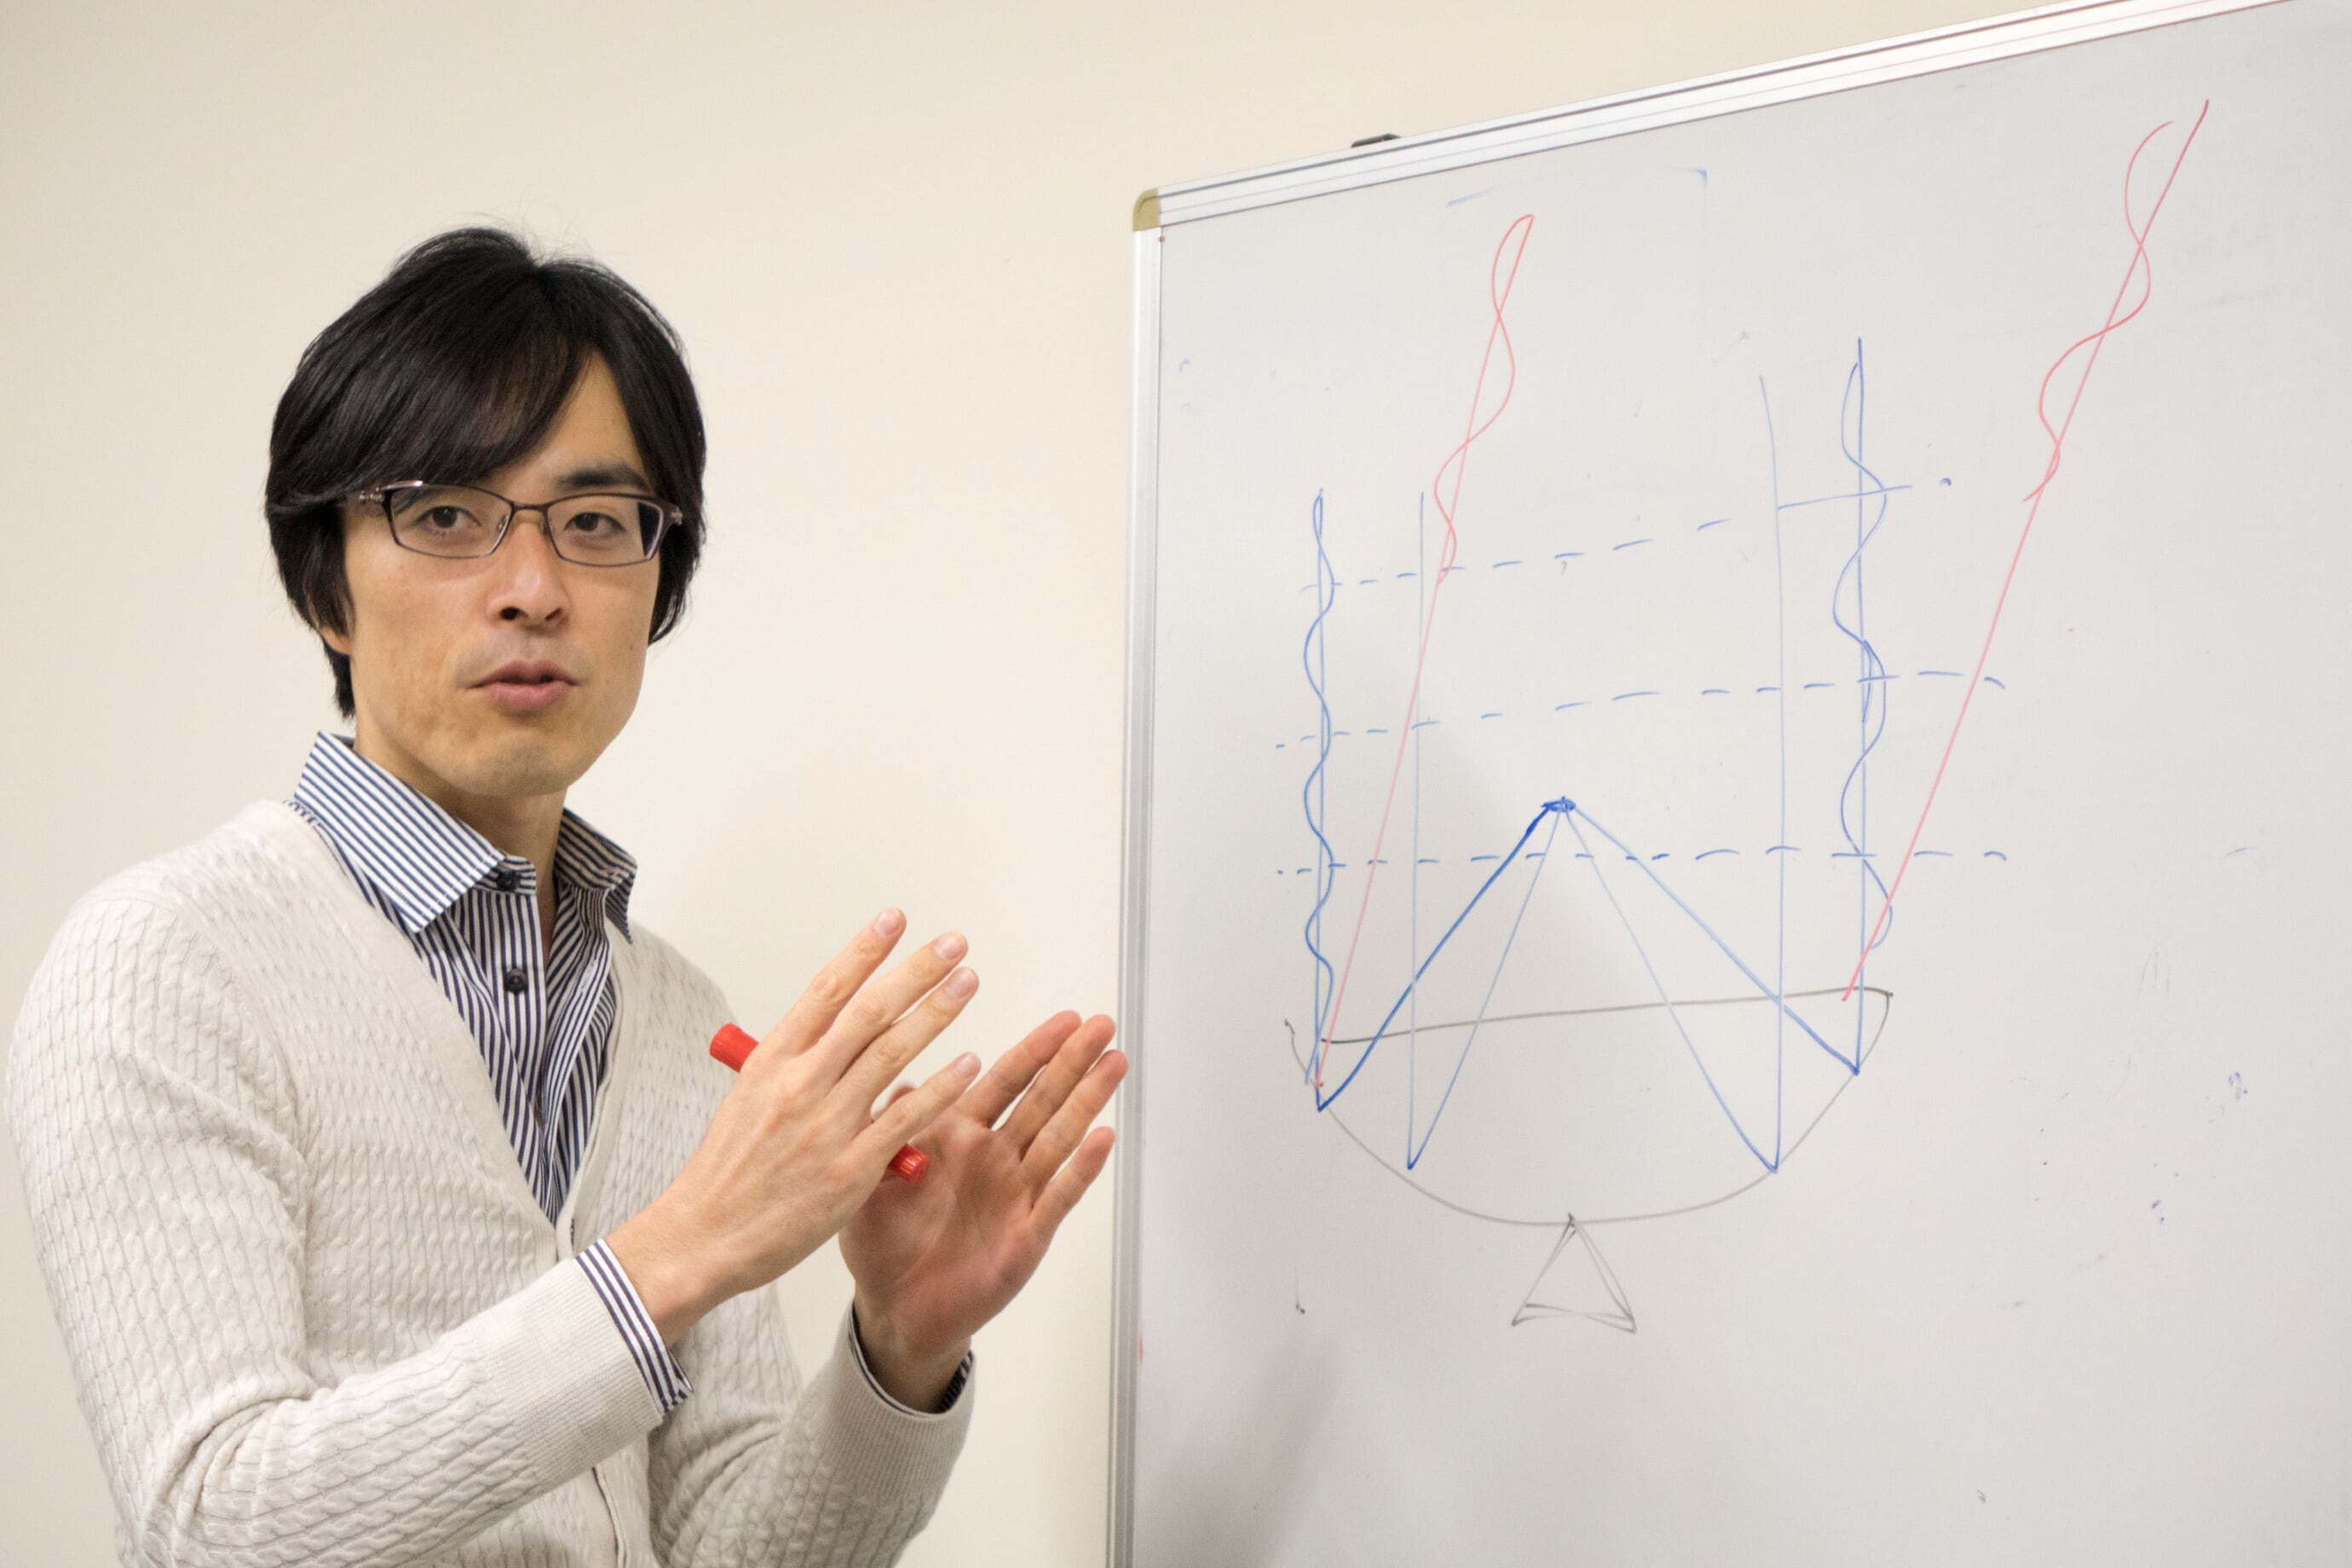
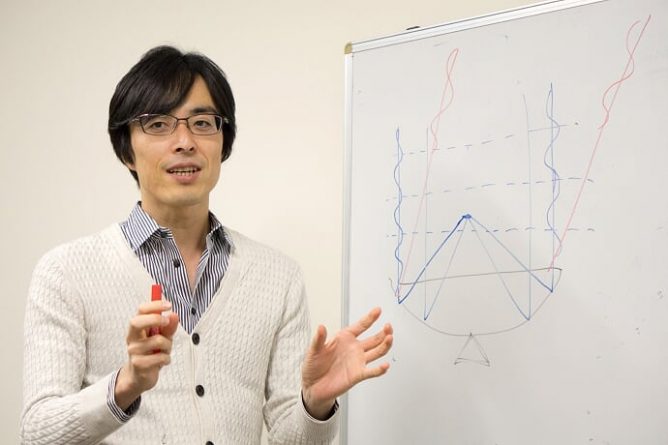
Hiroshi Nagai, Project Associate Professor at the NAOJ Chile Observatory
Credit: NAOJ
── It feels more like “hearing” radio waves, rather than “seeing”.
Nagai: Thinking of a mobile phone or a radio, it looks like we are “listening” to them. Also, I remember a scene in the old movie “Contact” where the leading character was hearing radio waves coming from the space.
— It’s a science-fiction movie starring Jodie Foster as an astronomer.
Nagai: Right. The leading character receives radio signals sent from an extraterrestrial civilization and listens to them with a headset. But, actually, we astronomers do not listen to radio waves (laugh).
— What are astronomers actually doing then?
Nagai: Let’s put aside the topic of radio telescopes for now. When we “see” things with eyes or with camera, we are getting basically two types of information: one is intensity of light and another is color. Technically speaking, color is the wavelength of light.
Now, putting aside the color, imagine a black and white photo. Each pixel of the photo represents the intensity of light and forms a grayscale image as a whole. Radio observation does exactly the same thing, because it visualizes the intensity of radio waves coming from the universe as an image. Radio waves are invisible to the human eye and we don’t know what color the emission really is, but we can produce a radio image by showing the intensity of radio emission of each pixel in grayscale.
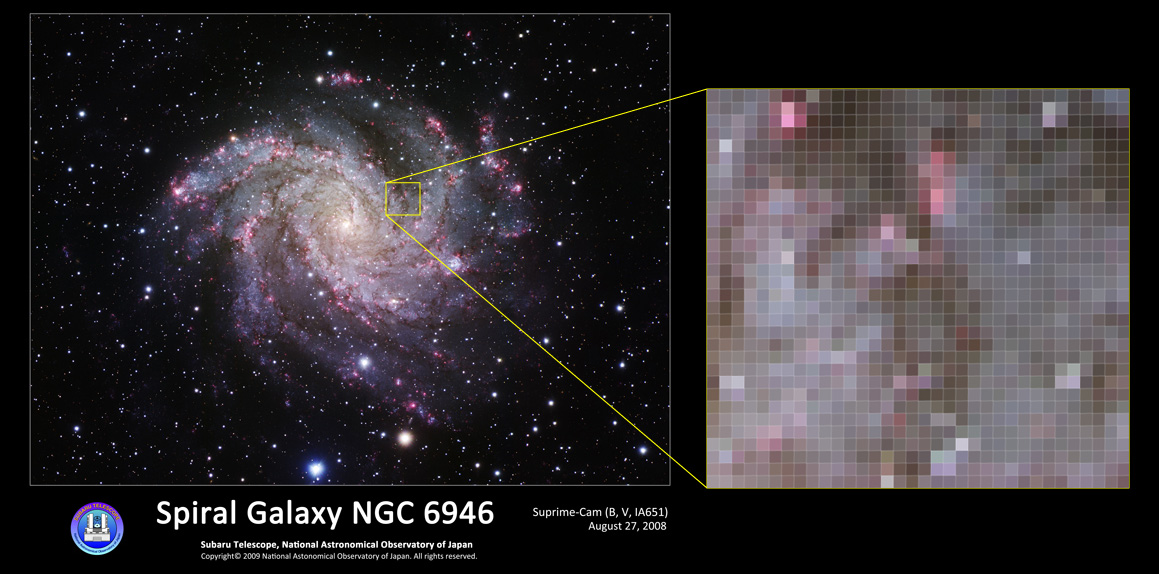
A photo of a spiral galaxy captured with the Subaru Telescope. In an enlarged portion, we can see pixels. The scaling represents the intensity of light.
Credit:NAOJ
— Exactly the same as visible light. Very easy to understand.
Nagai: As mentioned earlier, the difference in color is the difference in wavelength. The same is true in radio waves. The role of the radio telescope is to measure the intensity and wavelengths (equivalent to colors) of radio emissions coming from the universe to create two-dimensional image.
— I think I got the meaning of “seeing at radio wavelengths”.
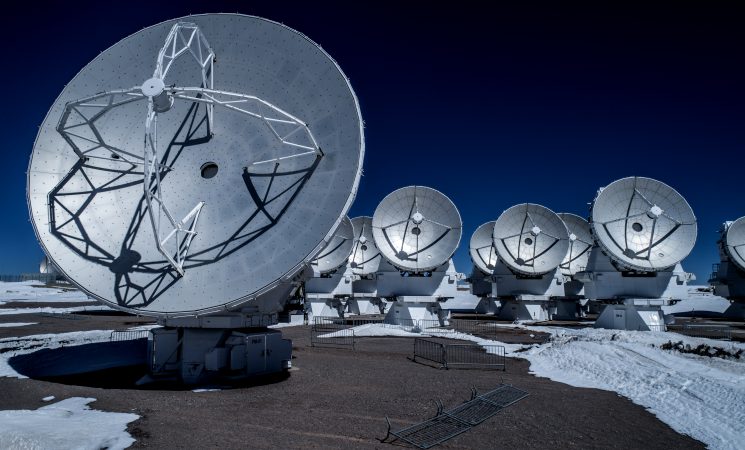
Nagai: It might sound simple, but we actually have complicated process in producing images from radio data received with a telescope. In particular, ALMA consists of 66 parabolic antennas that work as a single giant virtual radio telescope. This system is called “interferometer” and requires very difficult and delicate data handling. That’s why our team conducts reduction and imaging of the data.
Data reduction team maximizes the scientific output from ALMA
— In ALMA, obtained data is delivered to researchers after the data reduction team finishes reduction and imaging. What is the situation with other telescopes?
Nagai: As far as I know, ALMA is the only ground-based telescope that reduces all the data and delivers them to researchers, at least in the field of radio telescopes. In general, researches receive raw data obtained by the telescope. That policy is something like “Observation was done. Wishing your data analysis goes well. Good luck!” (laugh)
— Why does ALMA deliver processed data including even image data?
Nagai: The difference between raw data and processed data can be likened to a whole tuna and tuna fillets. If a whole tuna is delivered to your home, you will be at a loss of what to do with it. But if you receive processed tuna fillets, you know how to cook with them. In short, we are doing a cutting part of a whole fish.
— The analogy of a tuna is very easy to understand.
Nagai: It is quite difficult to handle raw ALMA data especially for someone who has no specialized skills in the radio interferometer. We have to avoid situations where researchers have troubles in writing papers with low-quality observation data or due to a lack of knowledge of how to create images. One of our aims is to reduce such situations and make ALMA available to a wide range of people including those who are not experts of the radio interferometer. To encourage the efficient use of ALMA data not only by the proposers of observations but also by other researchers, we need to provide processed data instead of raw data and make it available in the archives.
— Certainly, processed data can be handled more easily by other researchers.
Nagai: Since an enormous amount of money has been invested in ALMA, it is important to promote efficient and extensive use of obtained data by many researchers. If observation data together with image data is publicly available in the archives, researchers can start their work easily. I think ALMA’s fundamental policy is to encourage the use of valuable ALMA data by a wide range of people so that more and more great scientific results will be produced.

Credit:NAOJ
“Calibration” of Observation Data
— Could you explain the actual data processing in more detail?
Nagai: First, we need to “calibrate” the data. Calibration means data correction. Imagine we have radio data received by Antenna A and another radio data received by Antenna B which is remotely located. When the two waves are synthesized, we can have “interference” of the waves in technical terms. We need to synthesize the two waves detected precisely at the same time with each antenna, but if the sky above Antenna B is cloudy, there will be a slight delay in the arriving time of the radio wave that travels through water vapor in the air. Part of our calibration work is to calculate the difference of arriving time and perform data correction.
— How do you know the conditions where radio waves travel though clouds?
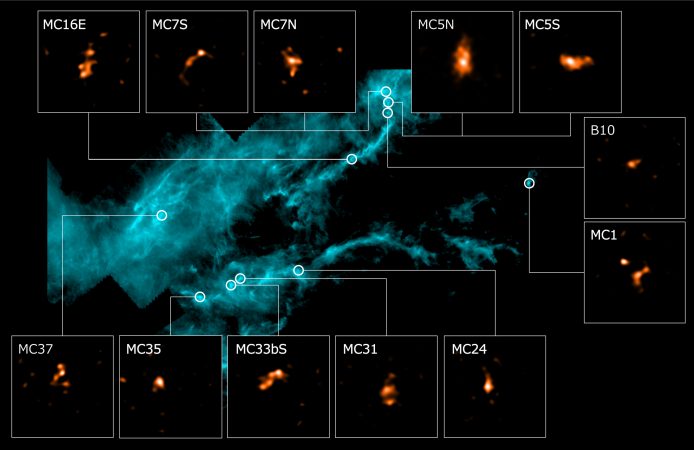
Nagai: We have various methods. For example, we use an instrument called “water vapor radiometer” installed in each antenna. The water vapor radiometer is designed to measure the amount of water vapor in the sky. We can calibrate the delay of radio waves using this data. Another method is to calculate the delay of radio waves from the results of actual observations of bright radio sources in the sky. If we have a delay, the obtained image of the object becomes blurry. Then, we conduct actual observations of an object that only looks like a point source and based on the obtained image, we correct blur.
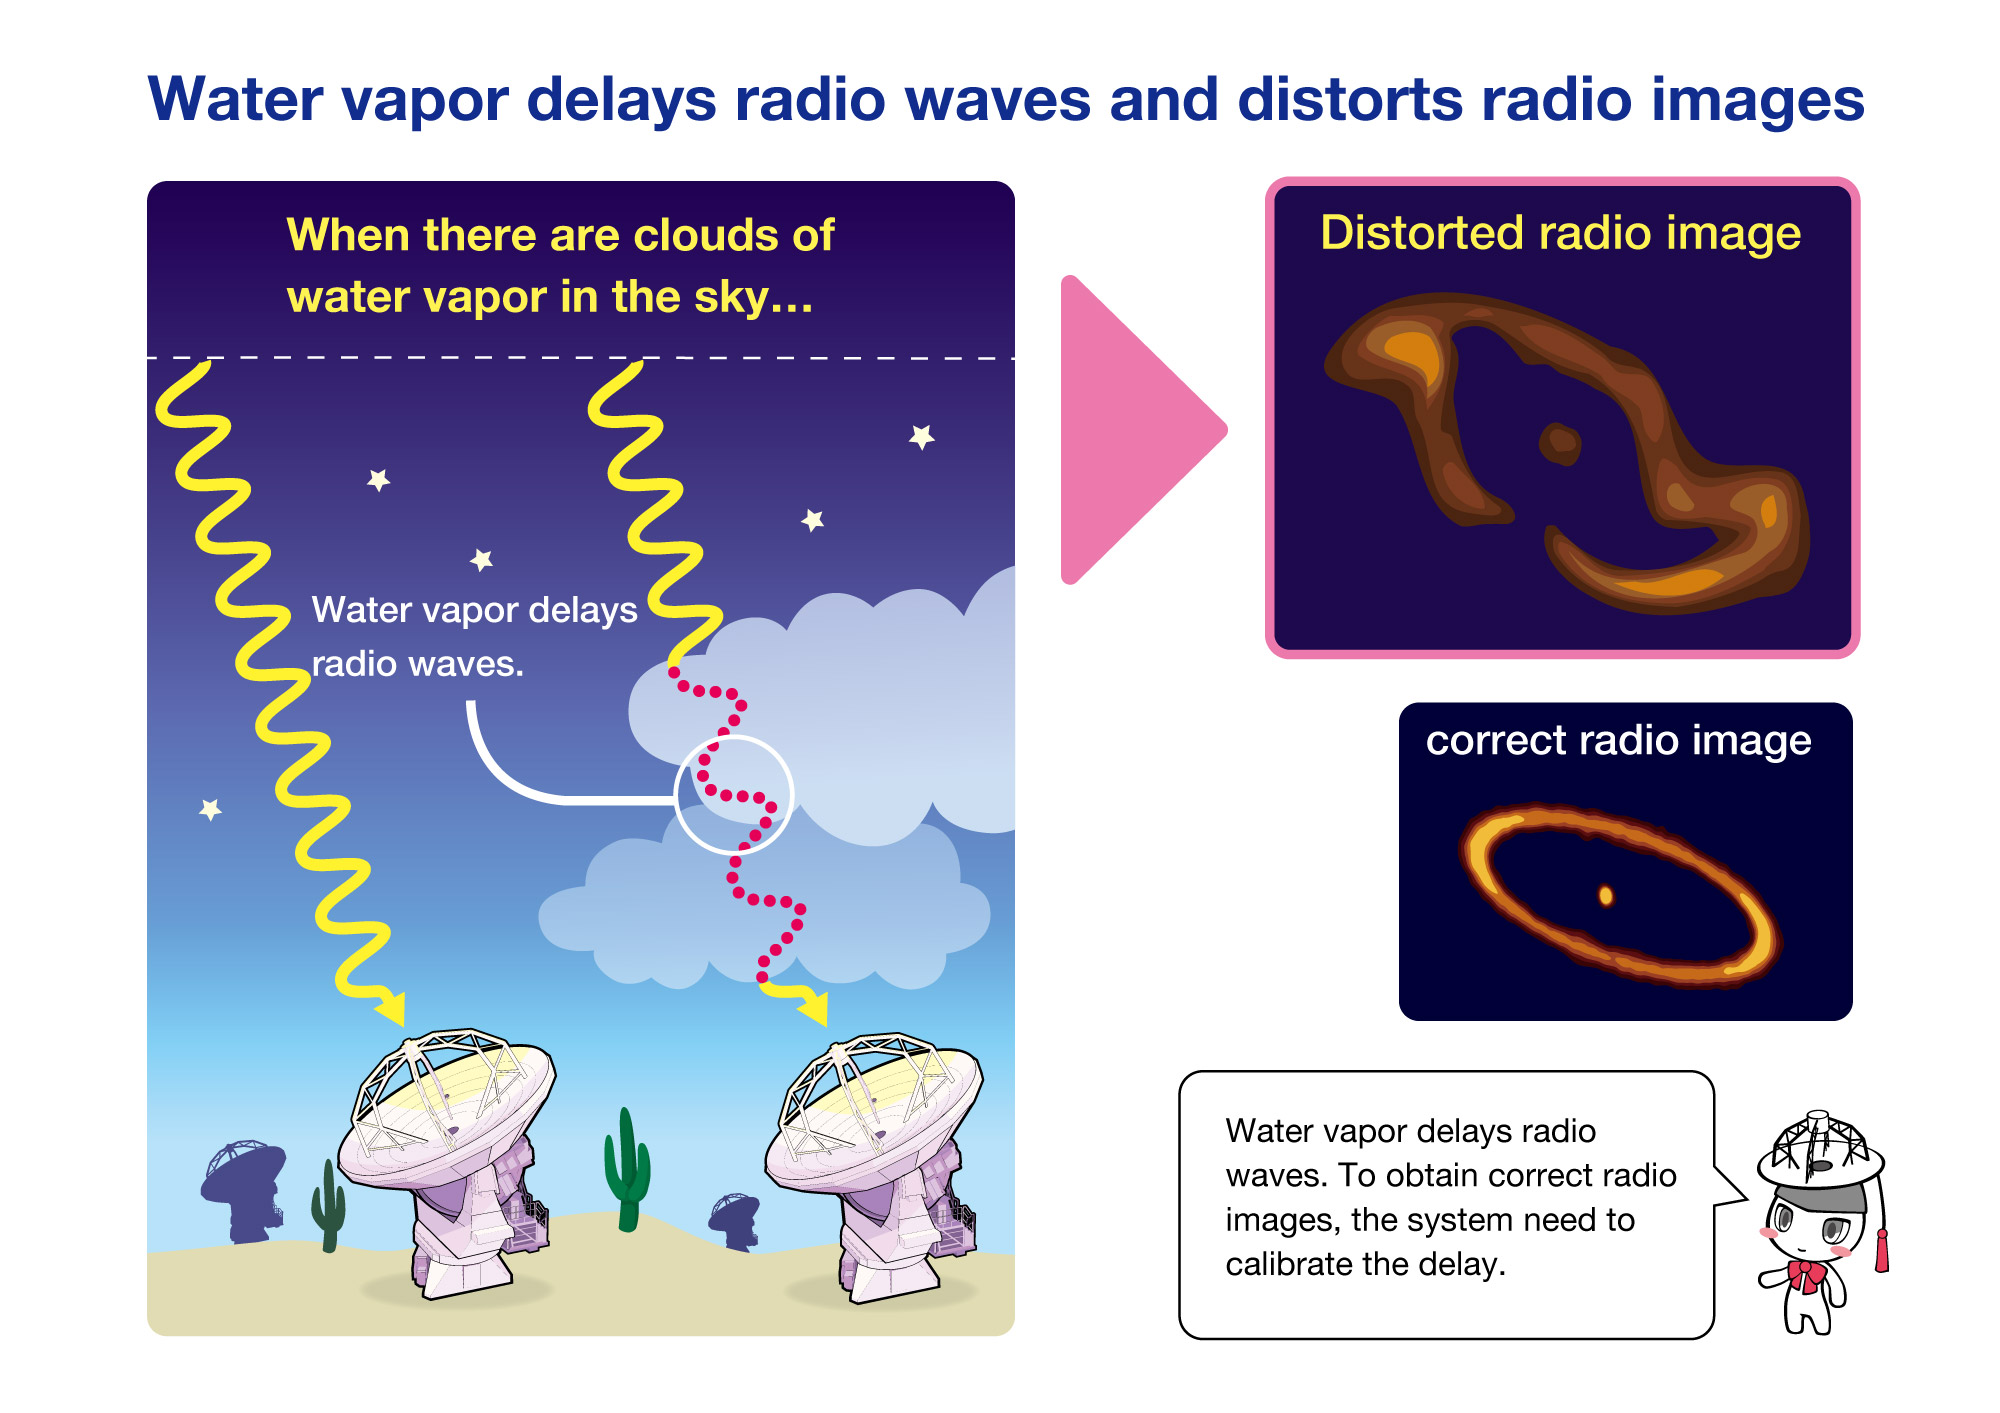
When there are clouds of water vapor in the sky, they block the paths of radio waves and cause delays. It results in distortion of a produced image because of failed synthesis of radio waves received by multiple antennas.
Credit: NAOJ
— What else will be done by calibration other than studying the delay of radio waves?
Nagai: We also perform calibration of radio intensity. It is not so easy to determine the intensity of radio waves emitted from astronomical objects. Because, ALMA has an extremely large and complicated system. The recorded signal passes all the way from the antenna, receiver, digital backend, optical fiber, to the correlator. But what astronomers want to know is how strong the radio emission was before entering the telescope. So, when we detect different intensity of radio wave in different epochs, we need to figure out whether the radio intensity of the object has really changed or it is affected by weather or instrument conditions of the telescope.
— How can you identify the cause?
Nagai: We use certain astronomical objects, whose radio intensities have already been known, as standard “calibration sources” for reference. Based on the reference value, we calibrate the radio intensity of the target object afterwards.
How to Decide the Colors of Astronomical Images?
— After calibrating the data received by ALMA, images will be created.
Nagai: Right. Imaging is also carried out by our team.
— You said that radio waves are invisible to the human eye and we don’t know what color the emission really is. But, we see colorful images in press releases. How do you color images?
Nagai: To tell the truth, we have no specific rules in coloring. There is a standard color allocation method provided by image visualization software, and we follow that method in principle.
— I see. Does the standard method use red colors for longer wavelengths and blue colors for shorter wavelengths as we can see with the naked eye?
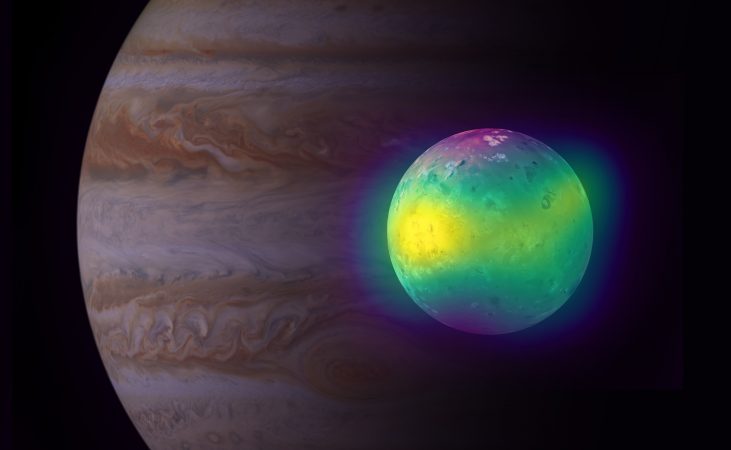
Nagai: We rarely allocate colors according to the wavelength. What we often use is “rainbow color” which is applied not according to the wavelengths but the radio intensity. As the intensity increases, the color becomes more reddish and as it decreases, the color becomes more purplish.
— Are you saying that researchers don’t care about what colors are used for imaging?
Nagai: Not much. They are more interested in the difference of radio intensity. So, we often use rainbow color so as to show the difference of radio intensity more clearly, instead of trying to make it look beautiful, even though we have no limitations set by the data format in choosing colors for images created by the analysis team.
— Do you use different color allocation methods in creating images for press releases to be released to the public?
Nagai: Yes, we do care more about creating visually appealing images for press releases.
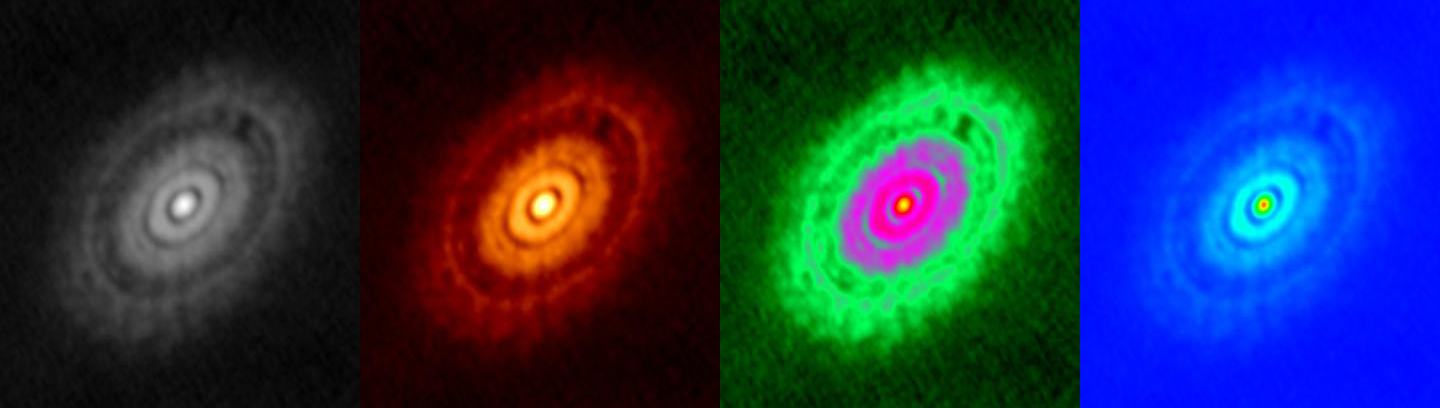
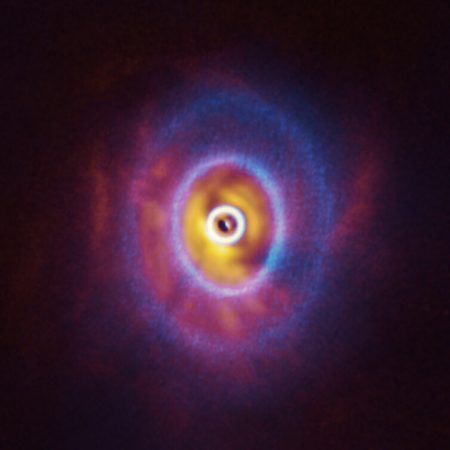
HL Tauri, observed with ALMA, shown with different colors. A variety of color allocation methods are available depending on the purpose of use and the points to be emphasized.
Credit: ALMA (ESO/NAOJ/NRAO)
Automatic Analysis System “Pipeline” Newly Introduced
— Do you perform calibration and imaging manually by each observation?
Nagai: Actually, we have a system called “Pipeline” to automatically perform calibration and imaging.
— Is that a name of software?
Nagai: Maybe more appropriate to say it is a “system” rather than software. We named it “Pipeline” because it automatically performs a series of processing from calibration to imaging just by feeding raw data. However, it didn’t work well initially and involved a lot of manual works. We had to keep proposers waiting long until they received their observation data
— You must have had a hard time.
Nagai: Yes, it was very hard at the beginning, but there was a dramatic improvement over the last year. As the development of Pipeline has progressed, we have less and less errors. The amount of our manual work was reduced substantially.
— Is analysis work carried out by each region?
Nagai: Yes, analysis work has been conducted separately in Chile, East Asia, North America, and Europe.
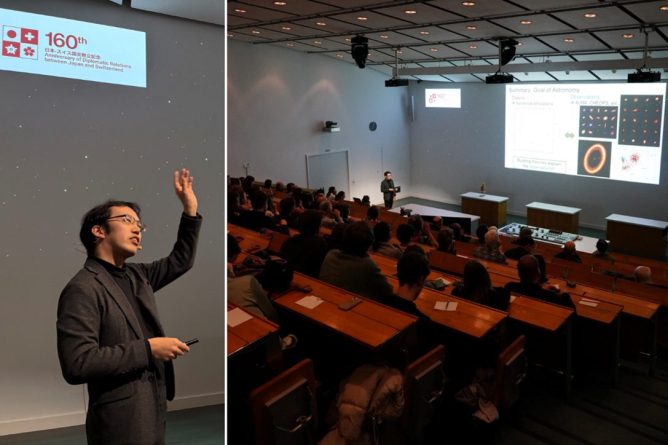
With Pride in Working for the World’s leading Telescope
— I guess you have difficulties in your data analysis work, but what is the fascinating part about your work?
Nagai: ALMA is the world’s leading telescope that has been producing more and more new scientific results and making amazing discoveries in exploration of mysteries of the universe. As a staff member of ALMA, I feel it very important to make efforts every day to ensure the delivery of high-quality data to the public. So, I am glad that I can contribute to the data analysis work, which is very rewarding. As data analysis requires profound knowledge of the radio interferometer, we are all proud of making professional contributions to this important work as members of the East Asian ALMA Regional Center.

Credit:NAOJ
— You are working with the spirit of professionalism.
Nagai: Also, through data analysis work, I get to know more people. ALMA users include a wide range of researchers from various fields of study. I used to work mostly with people of the same field, now I have more opportunities to be connected with researchers who have totally different expertise. And I have more contact with researchers of other fields in answering questions about data analysis and such contact sometimes leads to collaborative research. I enjoy these kinds of exchanges with new people very much.
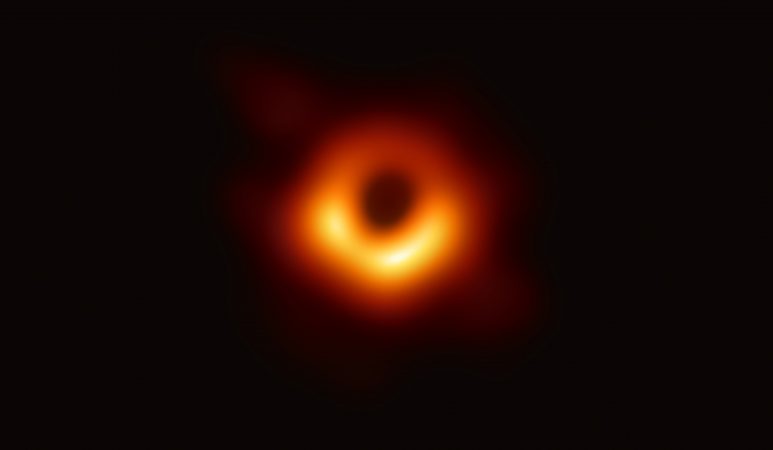
— We heard your specialty is study of black holes.
Nagai: Yes. I specialized in radio observation of jets in supermassive black holes.
— As a researcher, would you like to get back to your research when all the data analysis works were transferred to Chile?
Nagai: Researchers are wishing to keep doing research, so I dream about devoting 100% of my time and energy to my research. However, considering the importance of large-scale astronomical projects like ALMA for the advancement of astronomy, I understand specialized manpower will be continuously needed. So, taking the advantage of my experience with ALMA, I would like to utilize what I have learnt so far for the development of astronomy. I think it would be great if I could achieve a good balance between my project work and research and make even small portion of time for my research.