Swirling clouds, big colorful belts, giant storms — the beautiful and turbulent atmosphere of Jupiter has been showcased many times. But what is going on below the clouds? What is causing the many storms and eruptions that we see on the ‘surface’ of the planet? To see this, visible light is not enough. We need to study Jupiter using radio waves.
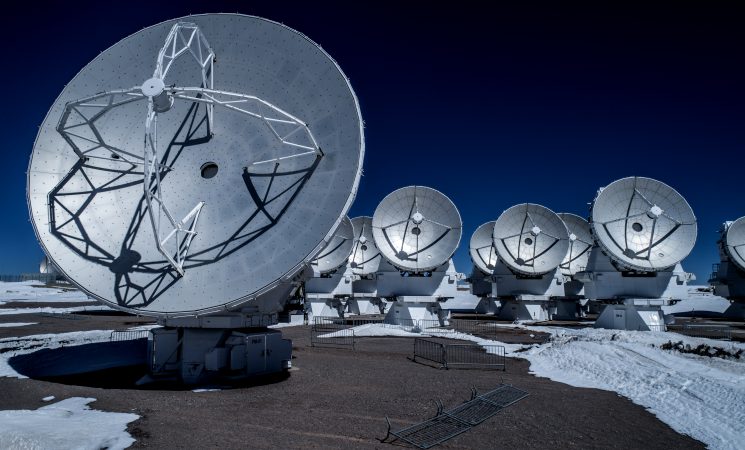
New radio wave images made with the Atacama Large Millimeter/submillimeter Array (ALMA) provide a unique view of Jupiter’s atmosphere down to fifty kilometers below the planet’s visible (ammonia) cloud deck.
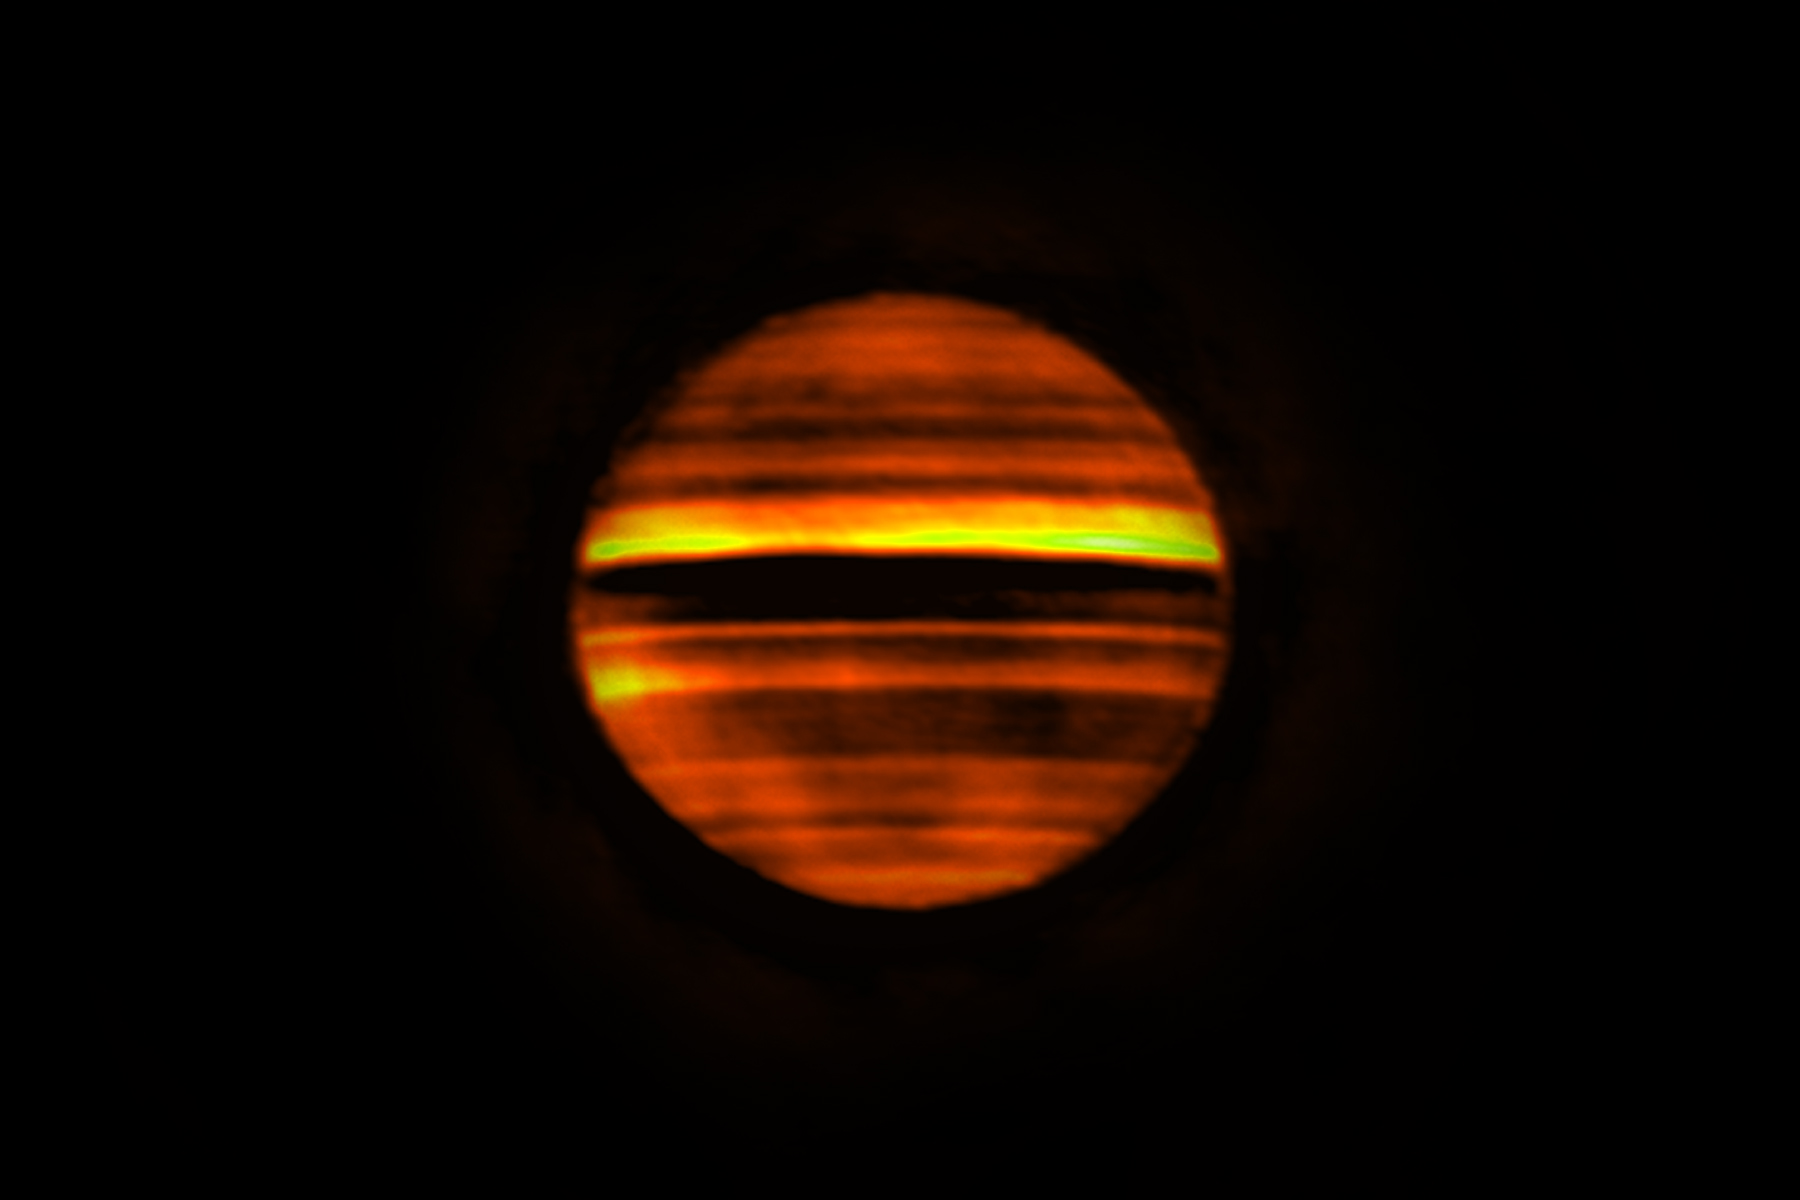
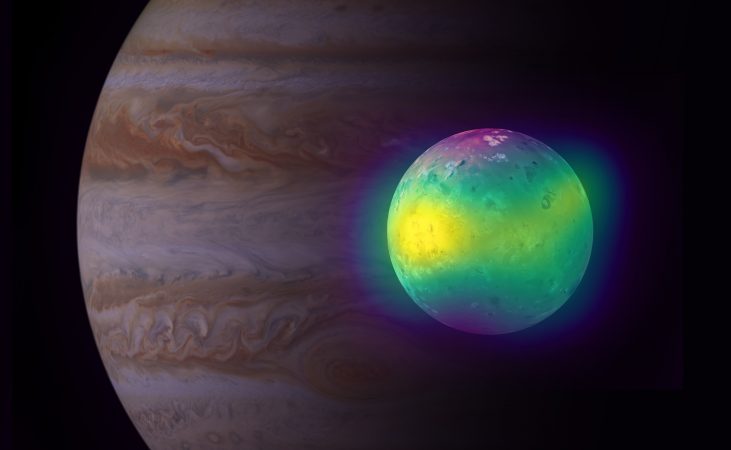
ALMA image of Jupiter. Bright bands indicate high temperatures and dark bands low temperatures. The dark bands correspond to the zones on Jupiter, which are often white at visible wavelengths. The bright bands correspond to the brown belts on the planet. This image contains over 10 hours of data, so fine details are smeared by the planet’s rotation.
Credit: ALMA (ESO/NAOJ/NRAO), I de Pater et al.; NRAO/AUI NSF, S. Dagnello
“ALMA enabled us to make a three-dimensional map of the distribution of ammonia gas below the clouds. And for the first time, we were able to study the atmosphere below the ammonia cloud layers after an energetic eruption on Jupiter,” said Imke de Pater of the University of California, Berkeley.
The atmosphere of gas giant Jupiter is made out of mostly hydrogen and helium, together with trace gases of methane, ammonia, hydrogen sulfide and water. The top-most cloud layer is made up of ammonia ice. Below that is a layer of solid ammonium hydrosulfide particles, and deeper still, around 80 kilometers below the upper cloud deck, there likely is a cloud layer of liquid water. Variations in the upper clouds form the distinctive brown belts and white zones seen from Earth.
Many of the storms on Jupiter take place inside those belts. They can be compared to thunderstorms on Earth and are often associated with lightning events. Storms reveal themselves in visible light as small bright clouds, referred to as plumes. These plume eruptions can cause a major disruption of the belt, which can be visible for months or years.
The ALMA images were taken a few days after amateur astronomers observed an eruption in Jupiter’s South Equatorial Belt in January 2017. A small bright white plume was visible first and then a large-scale disruption in the belt was observed that lasted for weeks after the eruption.
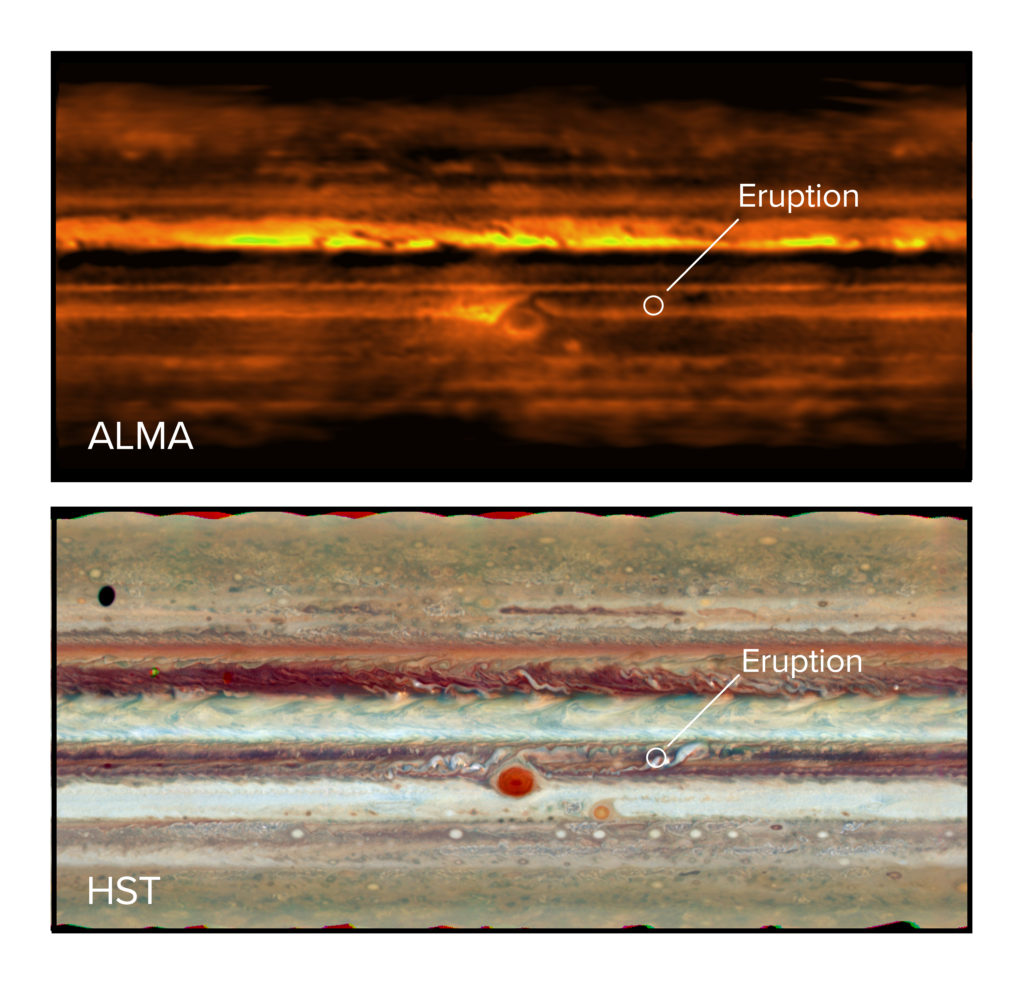
Jupiter in radio waves with ALMA (top) and visible light with the Hubble Space Telescope (bottom). The eruption in the South Equatorial Belt is visible in both images.
Credit: ALMA (ESO/NAOJ/NRAO), I de Pater et al.; NRAO/AUI NSF, S. Dagnello; NASA/Hubble
De Pater and her colleagues used ALMA to study the atmosphere below the plume and the disrupted belt at radio wavelengths and compared these to UV-visible light and infrared images made with other telescopes at approximately the same time.
“Our ALMA observations are the first to show that high concentrations of ammonia gas are brought up during an energetic eruption,” said de Pater. “The combination of observations simultaneously at many different wavelengths enabled us to examine the eruption in detail. This led us to confirm the current theory that energetic plumes are triggered by moist convection at the base of water clouds, which are located deep in the atmosphere. The plumes bring up ammonia gas from deep in the atmosphere to high altitudes, well above the main ammonia cloud deck,” she added.
“These ALMA maps at millimeter wavelengths complement the maps made with the National Science Foundation’s Very Large Array in centimeter wavelengths,” said Bryan Butler of the National Radio Astronomy Observatory. “Both maps probe below the cloud layers seen at optical wavelengths, and show ammonia-rich gases rising into and forming the upper cloud layers (zones), and ammonia-poor air sinking down (belts).”
This article was originally published by the National Radio Astronomy Observatory.
Paper and the Research Team
This observation results are published as I. de Pater, et al. ”First ALMA Millimeter Wavelength Maps of Jupiter, with a Multi-Wavelength Study of Convection” in the Astronomical Journal.
The research team members are:
Imke de Pater (University of California, Berkeley), R. J. Sault (University of Melbourne), Chris Moeckel (University of California, Berkeley), Arielle Moullet (SOFIA/USRA), Michael H. Wong (University of California, Berkeley), Charles Goullaud (University of California, Berkeley), David DeBoer (University of California, Berkeley), Bryan Butler (National Radio Astronomy Observatory), Gordon Bjoraker (NASA Goddard Space Flight Center), Mate Adamkovics (Clemson University), Richard Cosentino (NASA Goddard Space Flight Center), Padraig T. Donnelly (University of Leicester), Leigh N. Fletcher (University of Leicester), Yasumasa Kasaba (Tohoku University), Glenn Orton (Jet Propulsion Laboratory), John Rogers (British Astronomical Association), James Sinclair (Jet Propulsion Laboratory), Eric Villard (Joint ALMA Observatory)